
TL;DR
- Most small business owners have no idea whether their website is generating clients, because they have never set up the tracking that would tell them.
- The two most important metrics are goal completions (contact form submissions, phone clicks) and contact page visits. Everything else is secondary.
- Google Analytics 4 and Google Search Console are both free and give you everything you need to answer this question without specialist knowledge.
- This post explains exactly what to set up and what to look at to get a clear picture of whether your site is working.
Most business owners who come to us for a new website have one thing in common: they cannot tell us whether their current site is generating business or not. They have a rough sense. They know some clients mentioned the website. But they have no actual data.
This is completely normal and also completely fixable. You do not need to be technical to answer the question of whether your website is helping you get clients. You need two free tools and about an hour to set them up properly.
The metrics that actually matter
There are dozens of website metrics you can track. Most of them are vanity metrics for small businesses. Here are the only ones that actually tell you whether your site is generating business.
Goal completions. A goal is a specific action that indicates a real business outcome: a contact form submission, a phone number click, an email link click, a booking made. These are the metrics that represent real potential clients. Everything else, including page views, unique visitors, and session duration, is context for these numbers, not the number itself.
Contact page visits. How many people are actually visiting your contact page? If traffic is coming to your site but almost no one is reaching the contact page, people are either not interested in reaching out or they cannot find how to do so. This tells you where the breakdown in the funnel is.
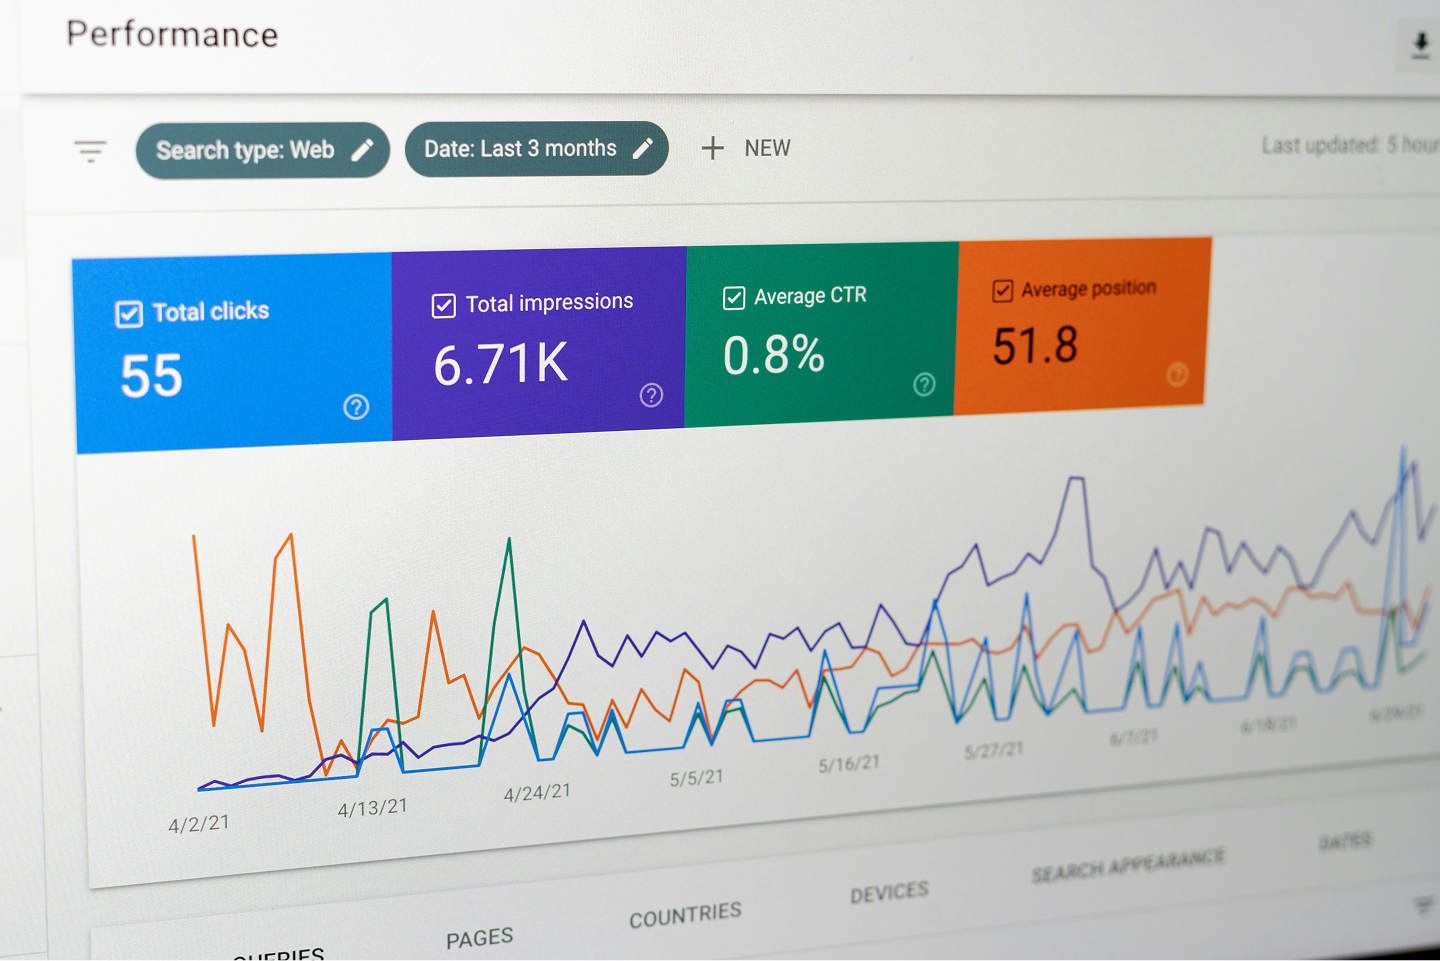
Organic search impressions and clicks. From Google Search Console, this tells you how often your site is appearing in search results and how many people are clicking through. If your site is showing up but no one is clicking, your title tags and meta descriptions need work. If your site is not showing up at all, you have an indexing or SEO problem.
Setting up goal tracking in Google Analytics 4
If you have Google Analytics 4 installed on your site (and if you do not, that is the first step), setting up basic goal tracking takes about 15 minutes.
In GA4, go to Configure, then Events, then mark your key events as conversions. For a service business, the events you want to mark as conversions are form_submit (if your contact form is set up to fire this event), click events on your phone number or email links, and any thank-you page views after a form submission.
If you use Webflow, forms automatically send a form_submit event to GA4 if it is correctly connected. Connecting GA4 to Webflow takes a few minutes in Site Settings under Integrations.
Once these are set up, you will have a clear daily picture of how many meaningful actions visitors are taking on your site.
What the numbers should look like
For context, here are typical benchmarks for a small service business website.
A conversion rate of 1% to 3% from organic traffic to contact form submission is normal for a site without specific CRO work. A well-optimised service page can convert at 3% to 5%. If you are converting at below 0.5% on significant traffic volume, there is a design or messaging problem worth addressing.
The contact page visit rate (contact page views divided by total sessions) should be somewhere between 3% and 10% for a service business. If it is below 2%, visitors are either not motivated to reach out or they cannot find where to do so.
What to do when the numbers are bad
If you set up tracking and find that your goal completions are very low despite meaningful traffic, that is diagnostic information. It tells you the traffic is not the problem. The conversion is.
Read our post on why your website gets visitors but no one contacts you for a breakdown of the specific causes and what to do about each one.
If you would rather have someone else look at your data and tell you what they see, get in touch and we will take a look.